")
")
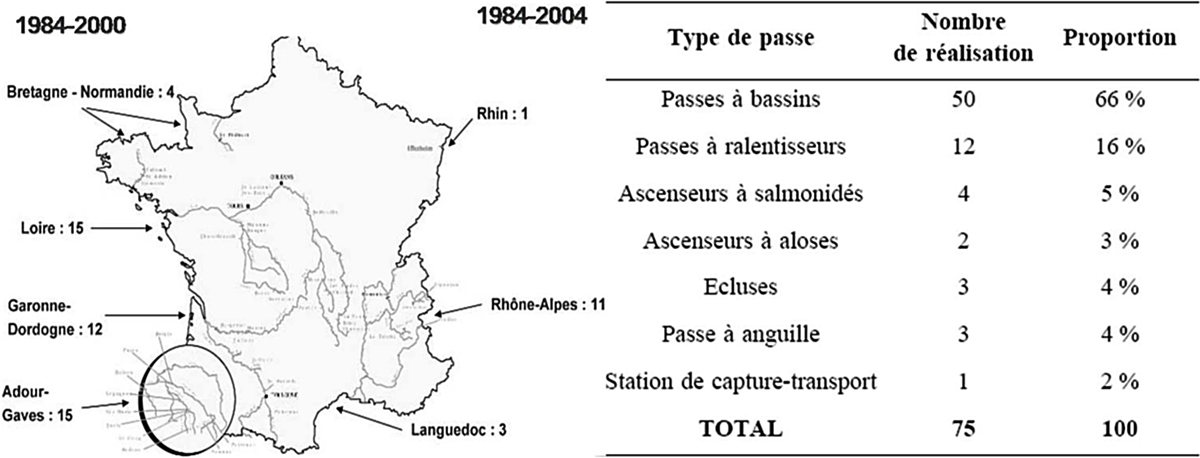
Fig. 1
Download original image
Répartition géographique des passes et nombre par type des passes construites sur les barrages EDF de 1984 à 2000 (carte, gauche) et de 1984 à 2004 (tableau, droite) en France (Travade, 2005).
Geographical repartition of fishways and the number of fishways built on EDF water dams from 1984 to 2000 (map, left) and from 1984 to 2004 (table, right) in France (Travade, 2005).
Current usage metrics show cumulative count of Article Views (full-text article views including HTML views, PDF and ePub downloads, according to the available data) and Abstracts Views on Vision4Press platform.
Data correspond to usage on the plateform after 2015. The current usage metrics is available 48-96 hours after online publication and is updated daily on week days.
Initial download of the metrics may take a while.