")
")
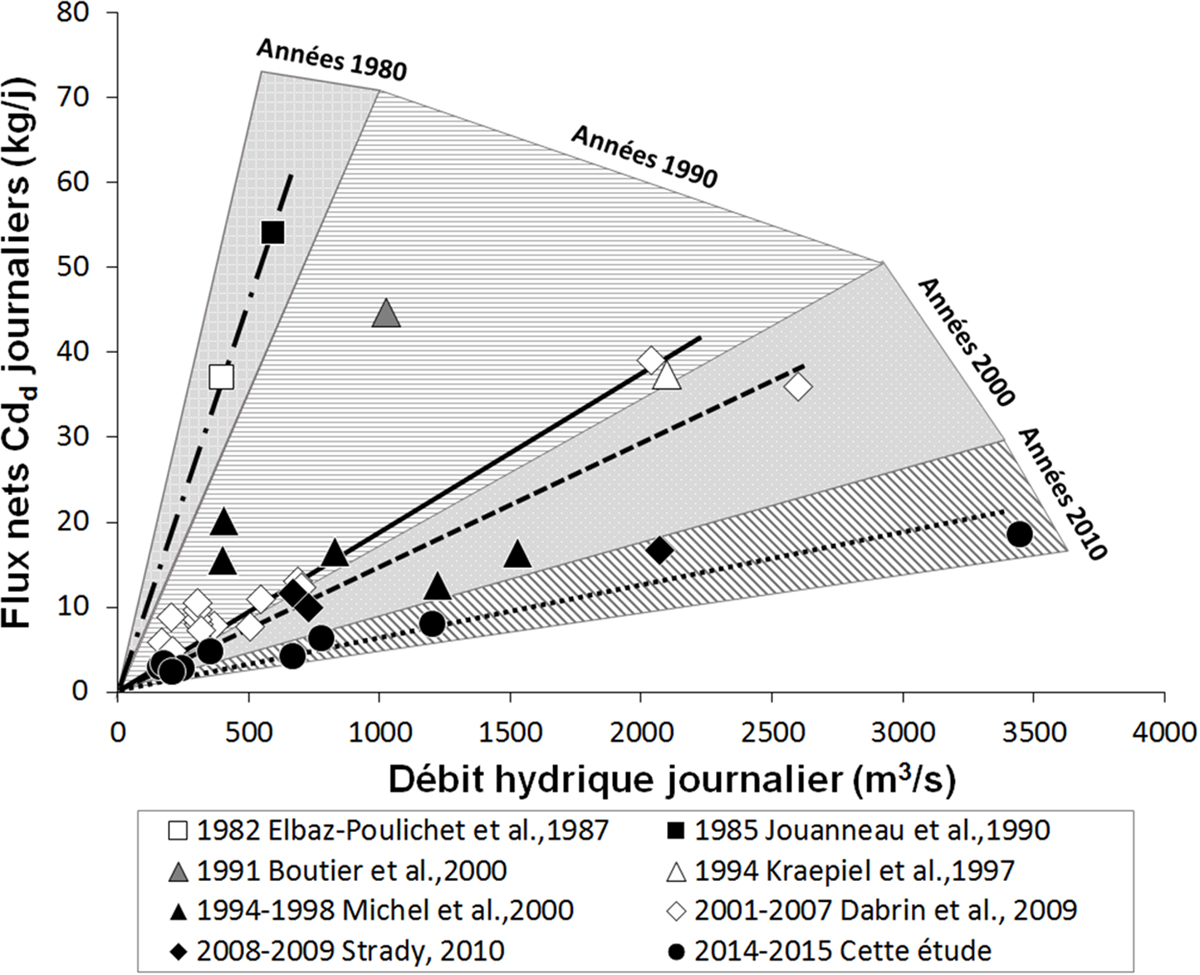
Fig. 3
Download original image
Flux nets journaliers de cadmium dissous (Cdd) en fonction des débits hydriques pour toutes les missions effectuées sur l’estuaire de la Gironde entre 1982 et 2015 (d’après Strady, 2010 modifiée).
Diagram showing daily Cd net fluxes (kg.day−1) versus daily discharges (m3/s) during Gironde estuary cruises from 1982 to 2015 (after Strady, 2010, modified).
Current usage metrics show cumulative count of Article Views (full-text article views including HTML views, PDF and ePub downloads, according to the available data) and Abstracts Views on Vision4Press platform.
Data correspond to usage on the plateform after 2015. The current usage metrics is available 48-96 hours after online publication and is updated daily on week days.
Initial download of the metrics may take a while.