Fig. 2

Download original image
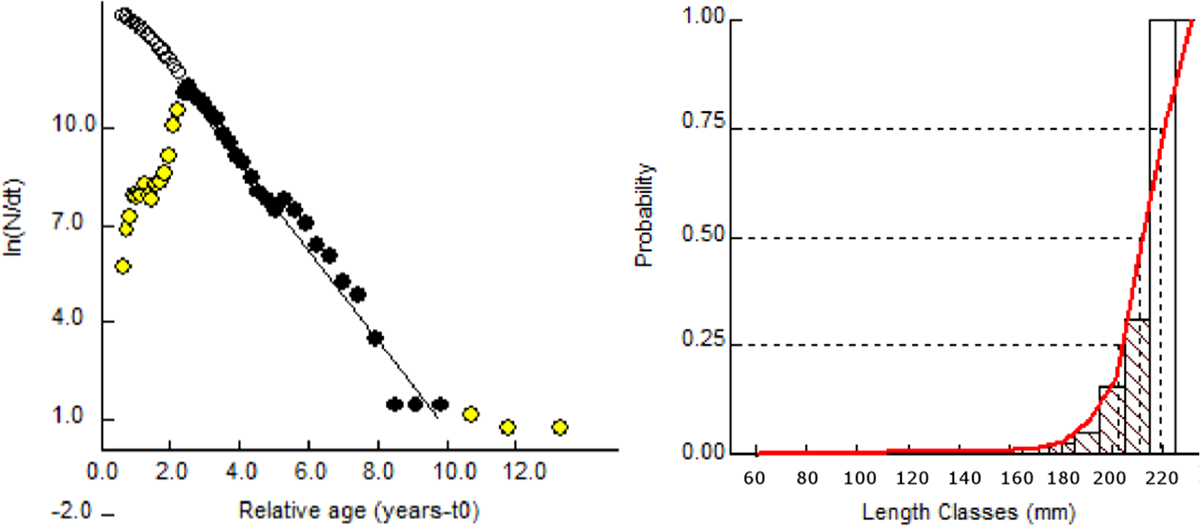
Length-converted catch curve (left) of O. niloticus (N = 11820) estimating annual instantaneous total mortality (Z) = 1.41 year−1; Natural mortality (at 26.5 °C) (M) = 0.30 year−1; Fishing mortality (F) = 1.11 year−1; Exploitation rate (E) = 0.79. NT2 Reservoir, Lao, PDR (year 2016). Black dots of the left figure were used for Z calculation (i.e. the slope) using least squares line regression (R2 = 0.98). The white dots represent the fish that would have been caught if fully recruited. The yellow dots on the left are the not fully recruited points discarded from the calculation; The ratio: expected and actual catches, gives probability of capture for each class size(right).
À gauche : Courbe des captures converties en tailles d’O. niloticus (N = 11820) estimant la mortalité instantanée annuelle (Z) = 1,41 an−1 ; naturelle (à 26,5 °C) (M) = 0,30 an−1 ; par pêche (F) = 1,11 an−1 ; le taux d’exploitation (E) = 0,79 pour Nam Theun 2 en 2016. Les ronds noirs correspondent aux données utilisées pour calculer Z en utilisant la régression linéaire des moindres carrées (R2 = 0.98). Les ronds blancs représentent les poissons qui auraient été capturés si le recrutement avait été total. Les ronds jaunes sont des données correspondant à un recrutement non total et écartés du calcul. À droite : Le ratio : les captures prévues et les captures réelles donnent la probabilité de capture pour chaque taille de classe.
Current usage metrics show cumulative count of Article Views (full-text article views including HTML views, PDF and ePub downloads, according to the available data) and Abstracts Views on Vision4Press platform.
Data correspond to usage on the plateform after 2015. The current usage metrics is available 48-96 hours after online publication and is updated daily on week days.
Initial download of the metrics may take a while.


