")
")
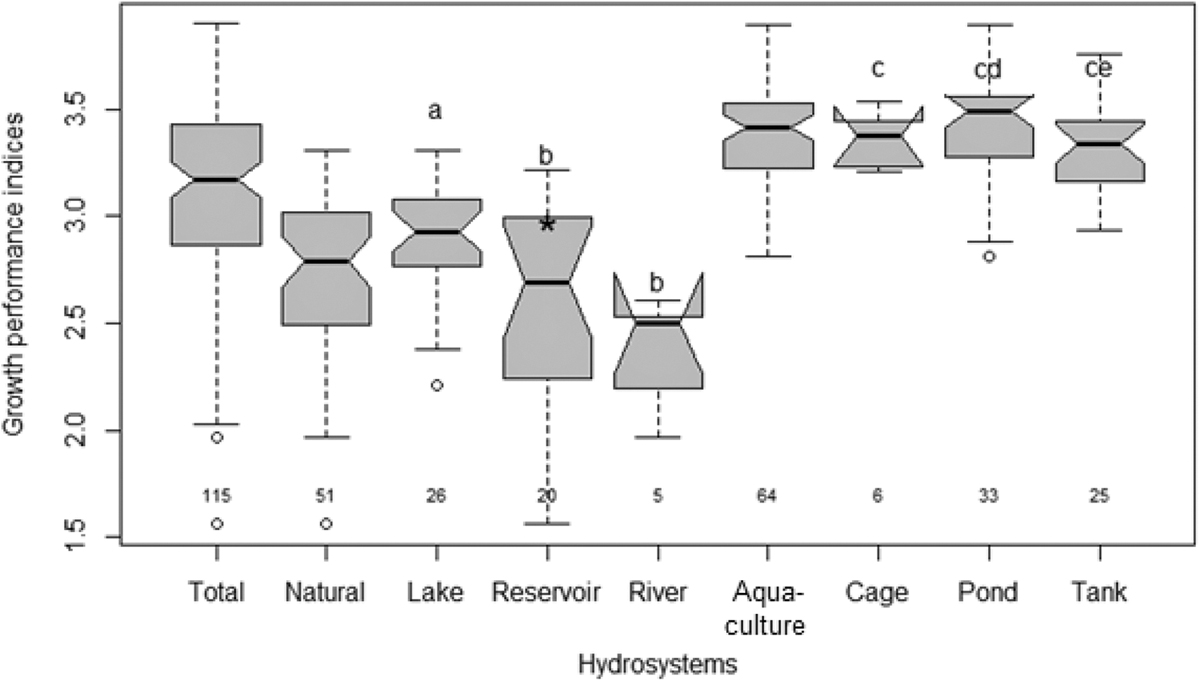
Fig. 7
Download original image
The growth performance indices (φ’) of Nile tilapia (O. niloticus) in various hydrosystems. Groups significantly different are represented by letters (Wilcoxon rank sum tests, P < 0.05). Below each box, the effective of bibliographic resources indicates the number of used. N are indicated below the boxes. The star represents the NT2 Reservoir, Lao PDR.
Les indices de performance de croissance (φ’) du Tilapia du Nil (O. niloticus) dans divers hydro-systèmes. Les groupes significativement différents sont identifiés par une lettre (test de Wilcoxon, P < 0,05. L’étoile représente Nam Theun 2 au Laos.
Current usage metrics show cumulative count of Article Views (full-text article views including HTML views, PDF and ePub downloads, according to the available data) and Abstracts Views on Vision4Press platform.
Data correspond to usage on the plateform after 2015. The current usage metrics is available 48-96 hours after online publication and is updated daily on week days.
Initial download of the metrics may take a while.