")
")
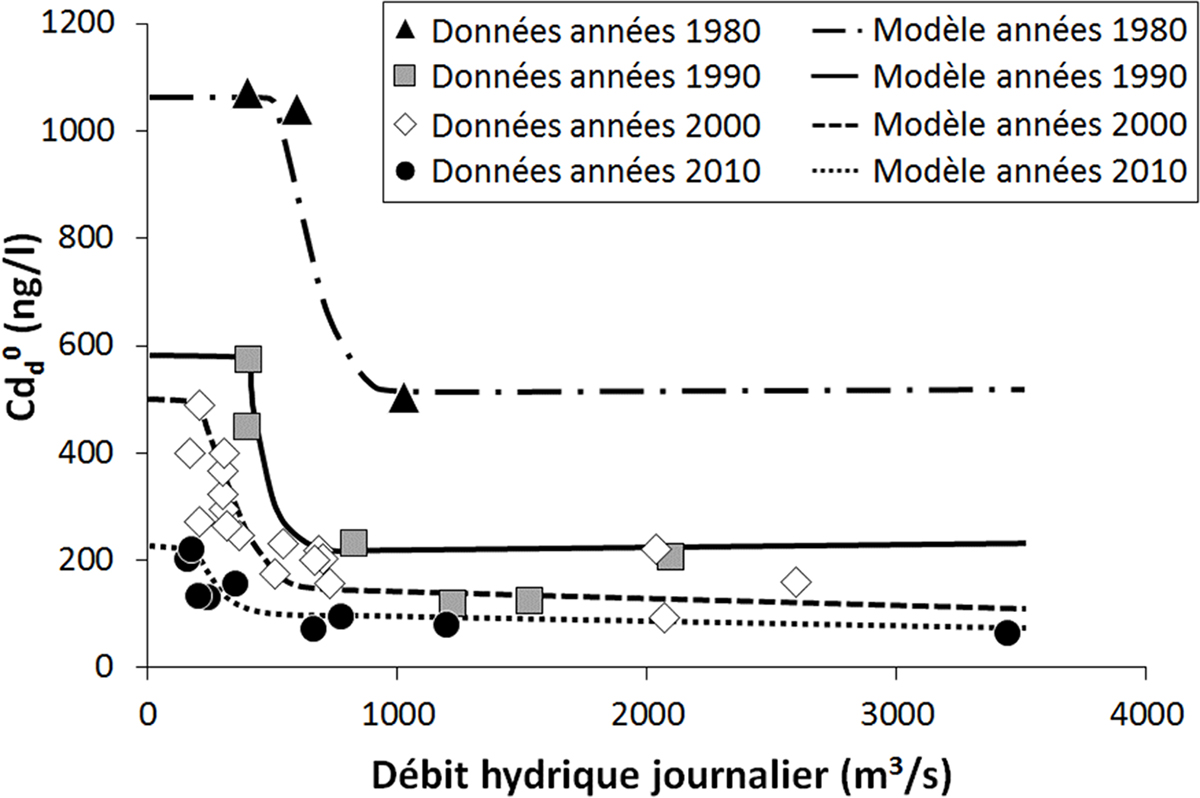
Fig. 5
Download original image
Diagramme présentant les lignes des fonctions exponentielles tronquées utilisées pour estimer les flux nets annuels de Cd dissous (t/an). Les cercles noirs correspondent aux données acquises en 2014 et 2015.
Diagram showing lines of the exponential functions with bounds used for estimation of the annual dissolved Cd net fluxes (t/an) over the four earlier decades. Black circles correspond to the data of this study.
Current usage metrics show cumulative count of Article Views (full-text article views including HTML views, PDF and ePub downloads, according to the available data) and Abstracts Views on Vision4Press platform.
Data correspond to usage on the plateform after 2015. The current usage metrics is available 48-96 hours after online publication and is updated daily on week days.
Initial download of the metrics may take a while.